What is Data Science: Data Science is a blend of various tools, algorithms, and machine learning principles with the goal to discover hidden patterns from the raw data. How is this different from what statisticians have been doing for years?
The answer lies in the difference between explaining and predicting.

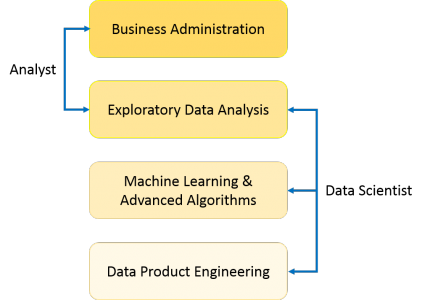
As you can see from the above image, a Data Analyst usually explains what is going on by processing history of the data. On the other hand, Data Scientist not only does the exploratory analysis to discover insights from it, but also uses various advanced machine learning algorithms to identify the occurrence of a particular event in the future. A Data Scientist will look at the data from many angles, sometimes angles not known earlier.
So, Data Science is primarily used to make decisions and predictions making use of predictive causal analytics, prescriptive analytics (predictive plus decision science) and machine learning.
- Predictive causal analytics – If you want a model which can predict the possibilities of a particular event in the future, you need to apply predictive causal analytics. Say, if you are providing money on credit, then the probability of customers making future credit payments on time is a matter of concern for you. Here, you can build a model which can perform predictive analytics on the payment history of the customer to predict if the future payments will be on time or not.
- Prescriptive analytics: If you want a model which has the intelligence of taking its own decisions and the ability to modify it with dynamic parameters, you certainly need prescriptive analytics for it. This relatively new field is all about providing advice. In other terms, it not only predicts but suggests a range of prescribed actions and associated outcomes.The best example for this is Google’s self-driving car which I had discussed earlier too. The data gathered by vehicles can be used to train self-driving cars. You can run algorithms on this data to bring intelligence to it. This will enable your car to take decisions like when to turn, which path to take, when to slow down or speed up.
- Machine learning for making predictions — If you have transactional data of a finance company and need to build a model to determine the future trend, then machine learning algorithms are the best bet. This falls under the paradigm of supervised learning. It is called supervised because you already have the data based on which you can train your machines. For example, a fraud detection model can be trained using a historical record of fraudulent purchases.
- Machine learning for pattern discovery — If you don’t have the parameters based on which you can make predictions, then you need to find out the hidden patterns within the dataset to be able to make meaningful predictions. This is nothing but the unsupervised model as you don’t have any predefined labels for grouping. The most common algorithm used for pattern discovery is Clustering.Let’s say you are working in a telephone company and you need to establish a network by putting towers in a region. Then, you can use the clustering technique to find those tower locations which will ensure that all the users receive optimum signal strength.
Let’s see how the proportion of above-described approaches differ for Data Analysis as well as Data Science. As you can see in the image below, Data Analysis includes descriptive analytics and prediction to a certain extent. On the other hand, Data Science is more about Predictive Causal Analytics and Machine Learning.
I am sure you might have heard of Business Intelligence (BI) too. Often Data Science is confused with BI. I will state some concise and clear contrasts between the two which will help you in getting a better understanding.
Lifecycle of Data Science
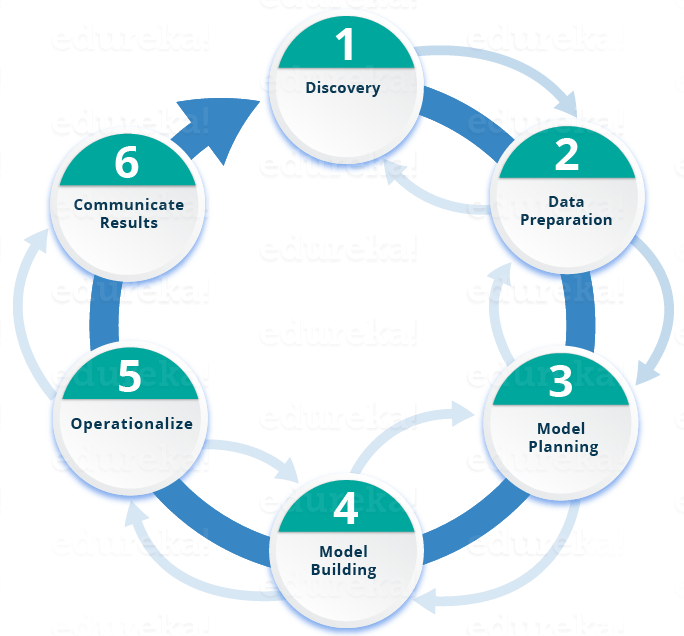
Here is a brief overview of the main phases of the Data Science Lifecycle:

 Phase 1—Discovery: Before you begin the project, it is important to understand the various specifications, requirements, priorities and required budget. You must possess the ability to ask the right questions. Here, you assess if you have the required resources present in terms of people, technology, time and data to support the project. In this phase, you also need to frame the business problem and formulate initial hypotheses (IH) to test.
Phase 2—Data preparation: In this phase, you require analytical sandbox in which you can perform analytics for the entire duration of the project. You need to explore, preprocess and condition data prior to modeling. Further, you will perform ETLT (extract, transform, load and transform) to get data into the sandbox. Let’s have a look at the Statistical Analysis flow below.

You can use R for data cleaning, transformation, and visualization. This will help you to spot the outliers and establish a relationship between the variables. Once you have cleaned and prepared the data, it’s time to do exploratory analytics on it. Let’s see how you can achieve that.
Phase 3—Model planning:  Here, you will determine the methods and techniques to draw the relationships between variables. These relationships will set the base for the algorithms which you will implement in the next phase. You will apply Exploratory Data Analytics (EDA) using various statistical formulas and visualization tools.
 Here, you will determine the methods and techniques to draw the relationships between variables. These relationships will set the base for the algorithms which you will implement in the next phase. You will apply Exploratory Data Analytics (EDA) using various statistical formulas and visualization tools.
Nice to read your article
ReplyDeleteData Science Online Training